Inputs
480 raw monthly observations: 8 synthetic companies across 60 months, plus 12 synthetic public-safe events.
Data product / Raw-data benchmark intelligence engine
A raw-data benchmark dashboard for share, rank, monetization, aggregation, and local scenario forecasts.
A public-safe benchmark intelligence dashboard that turns five years of synthetic monthly revenue and traffic observations into tracked market-share analysis, rankings, monetization diagnostics, period aggregation, and local scenario forecasts. The system starts from 480 raw monthly rows, then generates the intelligence layer in code: benchmark rows, shares, ranks, efficiency metrics, growth metrics, and forecast scenarios.
Demo mode only: synthetic companies, synthetic values, public-safe labels, and no real company, client, logo, or private source data.
Case Snapshot
The problem, the system response, the available proof, the strategic value, and the intentional boundary.
Business Context
Competitive analysis often lives in disconnected spreadsheets, screenshots, and one-off decks. The same questions repeat: who is gaining share, who is more efficient, which players are improving, and what may happen next.
System / Solution
A clean source_monthly contract feeds a canonical pipeline that validates raw observations, generates benchmark rows, calculates shares/ranks/efficiency metrics, creates local scenario forecasts, and renders the result as a React/Vite executive dashboard.
480 raw monthly observations: 8 synthetic companies across 60 months, plus 12 synthetic public-safe events.
Validation, canonical benchmark pipeline, generated market_total and market_average rows, forecast generation, view-model generation, and release checks.
Tracked benchmark-set share, ranks, growth, indexed metrics, revenue per visit, monetization gap, period aggregation, and forecast-derived metrics are calculated in code.
Executive dashboard, Players/company profiles, Battle Arena, forecast view, ranking tables, and public-safe data health context.
Synthetic-data discipline, no real client or competitor data, and public-readiness validation before publishing.
What changed
I rebuilt the project across several sprints: from prepared dashboard JSON to raw source_monthly observations, from static benchmark rows to generated market_total and market_average rows, from precomputed metrics to runtime calculations, and from fragile profile/battle routes to working Battle Arena and Players/company profile views.
The public JSON stores raw monthly observations only. Legacy data.interface payloads remain supported as backwards compatibility, but they are not the preferred source of truth.
market_total and market_average rows are generated at runtime from observed company rows, then excluded from share denominators and ranks where appropriate.
Market share, ranks, growth, indexed metrics, revenue per visit, monetization gap, annual aggregation, and range aggregation are calculated in code.
Executive dashboard, Players/company profiles, #/company/:id routes, legacy #/empresa/:id routes, Battle Arena, and Forecast view all work from generated canonical rows.
Architecture
The final architecture separates source data from benchmark intelligence. Raw monthly revenue and visits enter through data.source_monthly; the canonical pipeline validates the rows, normalizes entities, calculates benchmark metrics, generates synthetic benchmark rows, creates forecast rows, recalculates forecast-derived metrics, and returns dashboard-ready interface rows.
Five years of synthetic monthly revenue and visits: 2021-01-01 through 2025-12-01.
Accepts source_monthly rows and rejects derived benchmark fields from the raw source layer.
Builds dashboard-ready rows from raw observations while keeping the public JSON small, readable, and safe.
Calculates tracked benchmark-set share, ranks, indexed values, growth metrics, revenue per visit, and monetization gap.
The local_engine default projects revenue and visits, then sends forecast rows back through the benchmark pipeline.
Renders market overview, Players, Battle Arena, company profiles, forecast scenarios, and data health context.
Visual proof
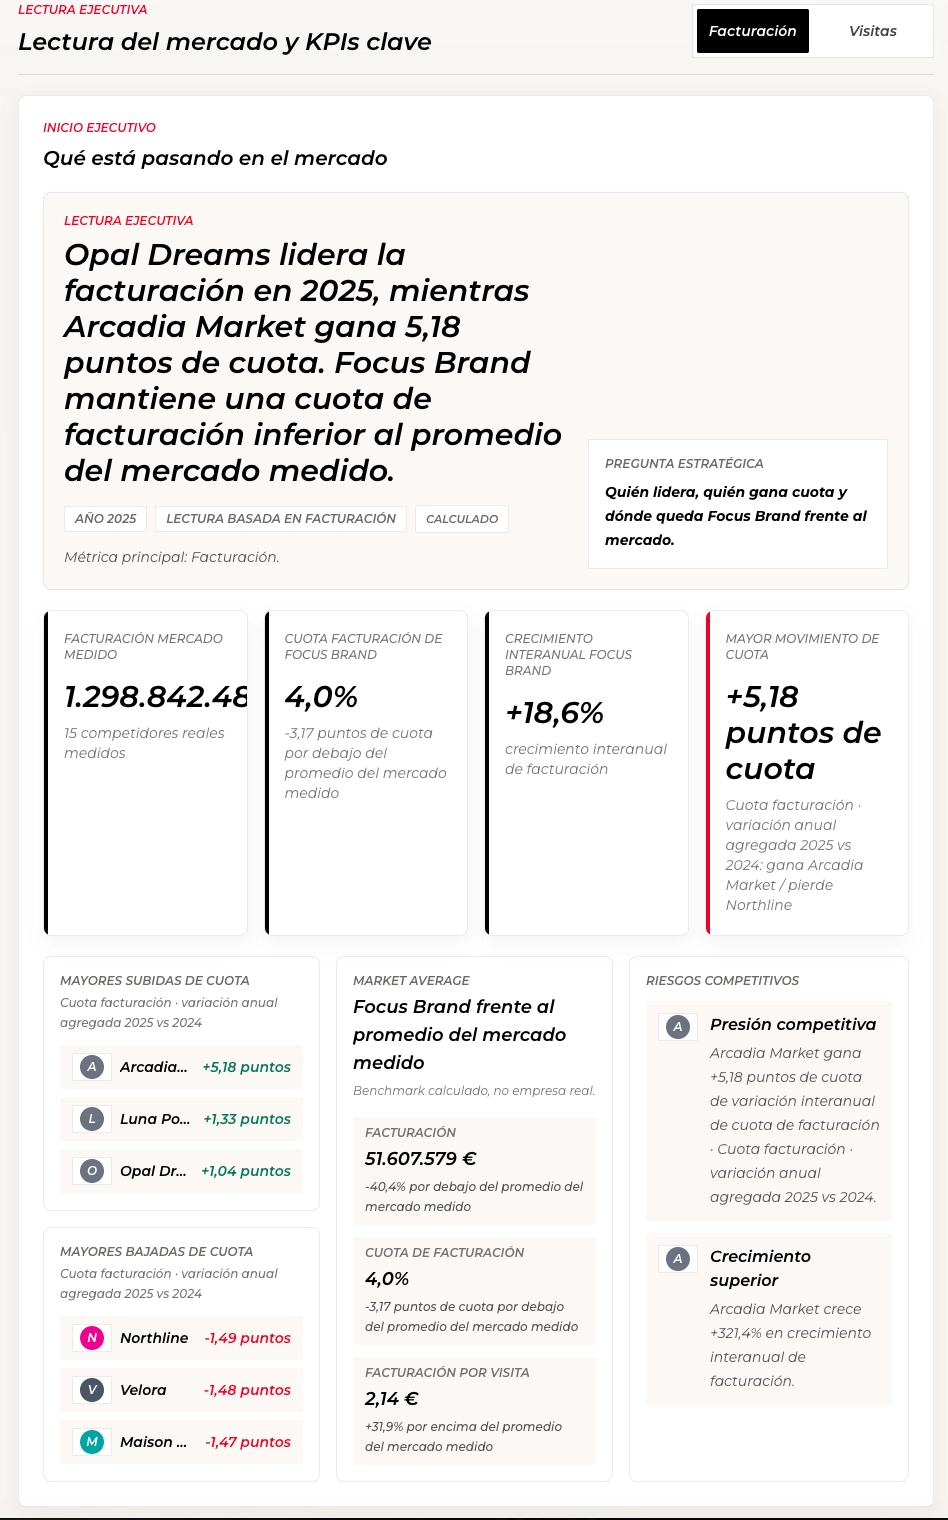
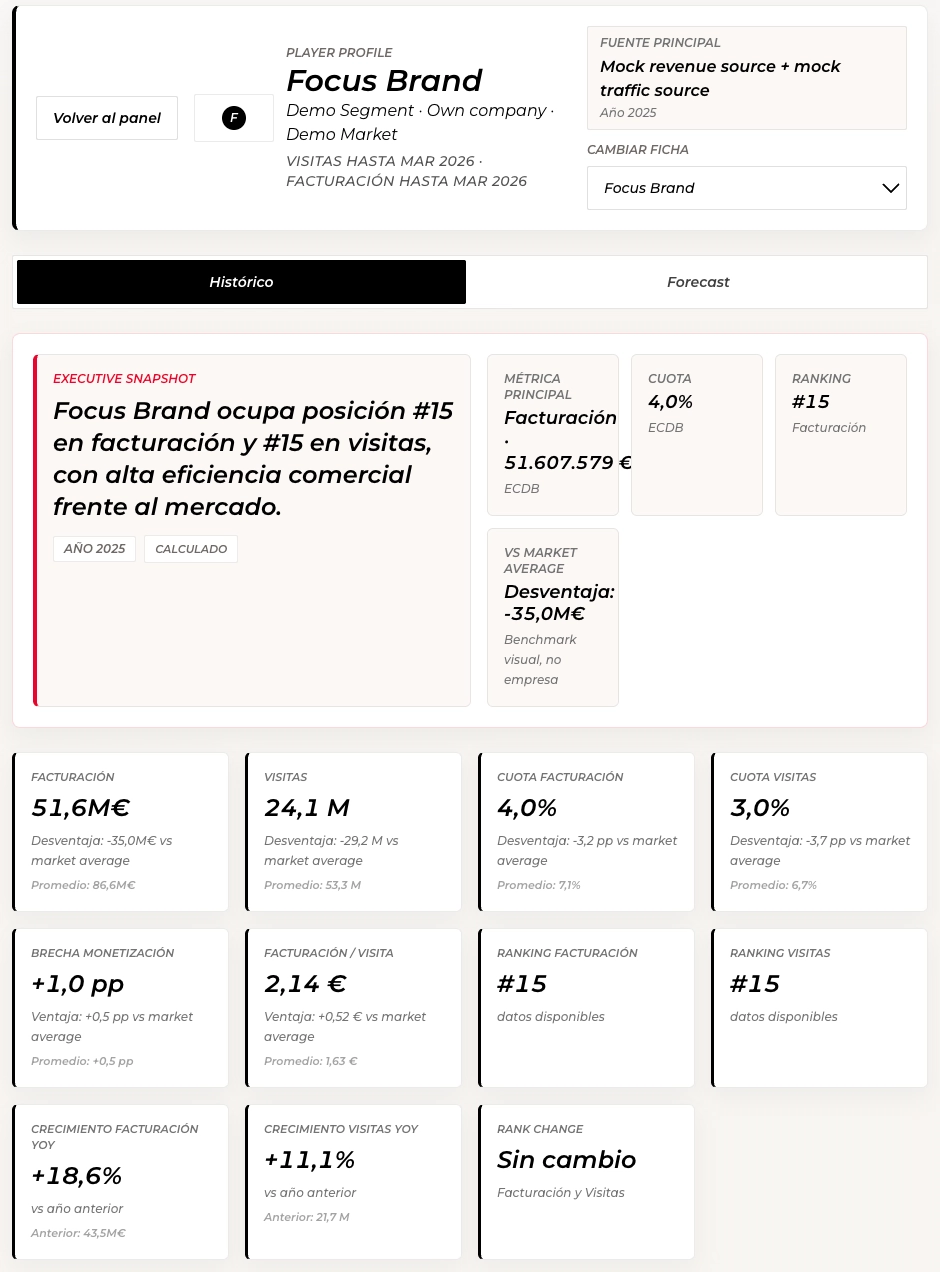
The shipped interface exposes the product surface around the pipeline: executive overview, rankings, market-share movement, Players/company profiles, Battle Arena comparisons, and forecast scenarios generated from the five-year history.

The interface is organized around working executive modes: market overview, Players, Battle Arena, and forecast workspace.
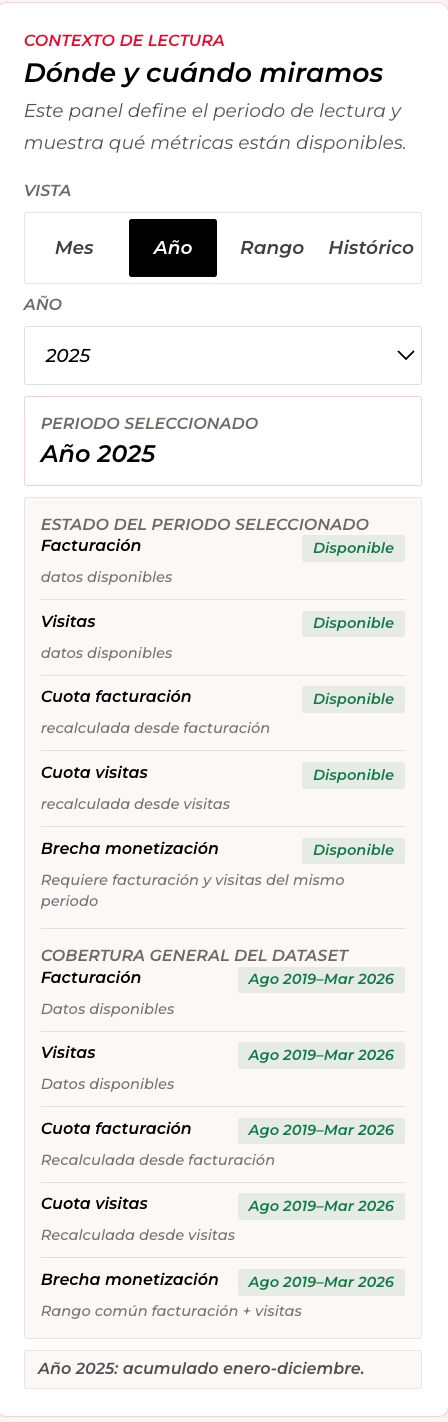
Annual and range aggregation are calculated from summed revenue and visits, then benchmark metrics are recalculated for the selected period.
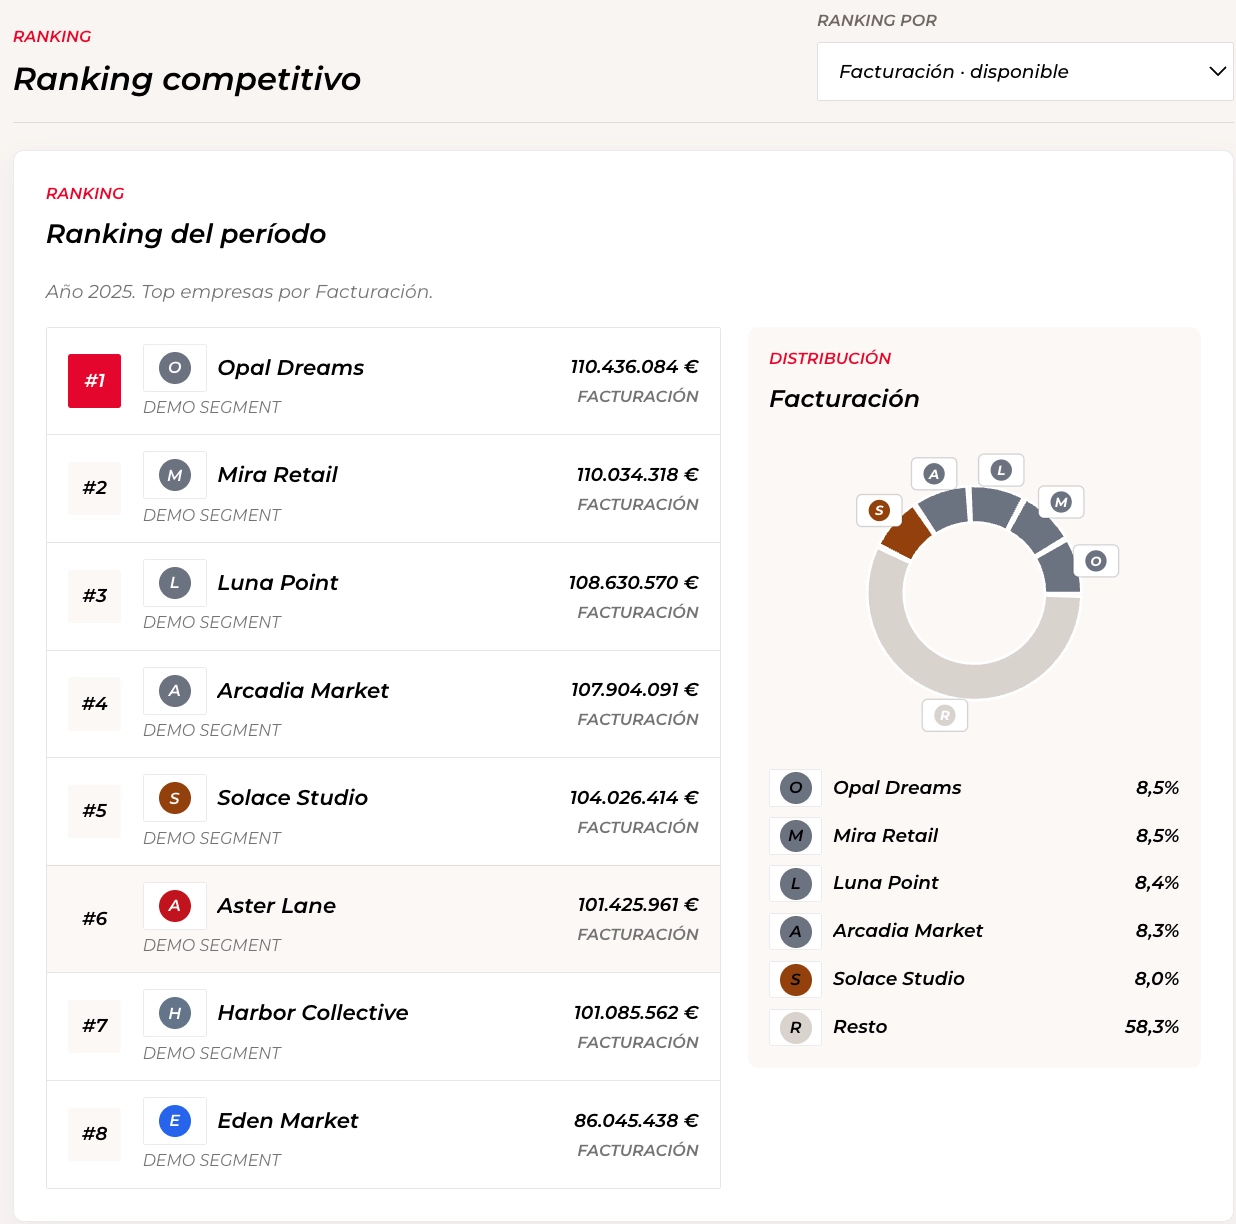
Ranking table with generated benchmark-set shares and ranks, useful for executive comparison without exposing real company data.
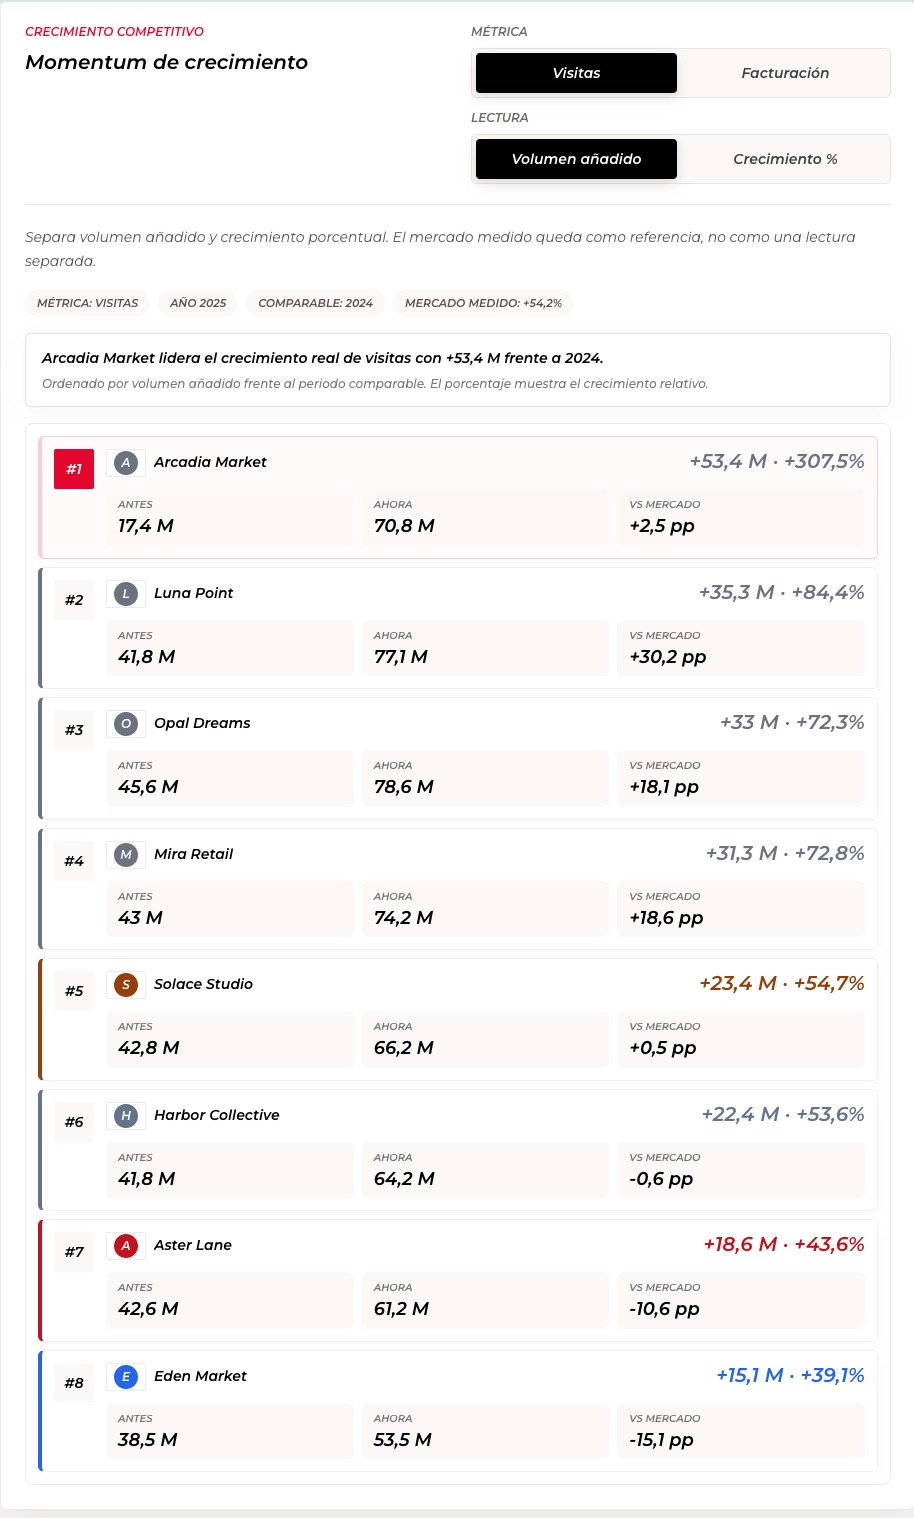
Indexed growth and YoY/MoM changes are generated from raw monthly observations rather than stored as final dashboard values.
Company profile showing generated historical and forecast metrics, available through #/company/:id and legacy #/empresa/:id routes.
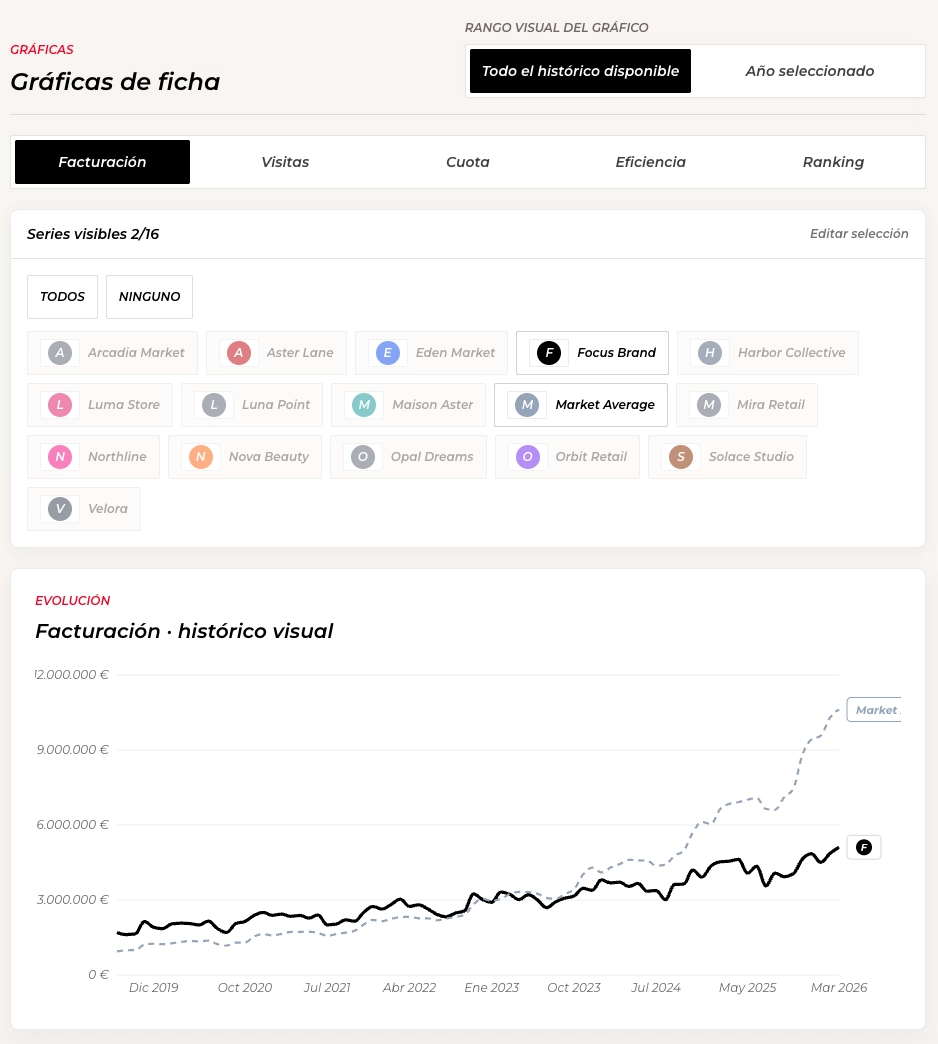
A focused graph workspace compares a player against generated market_average or selected peers across historical benchmark metrics.
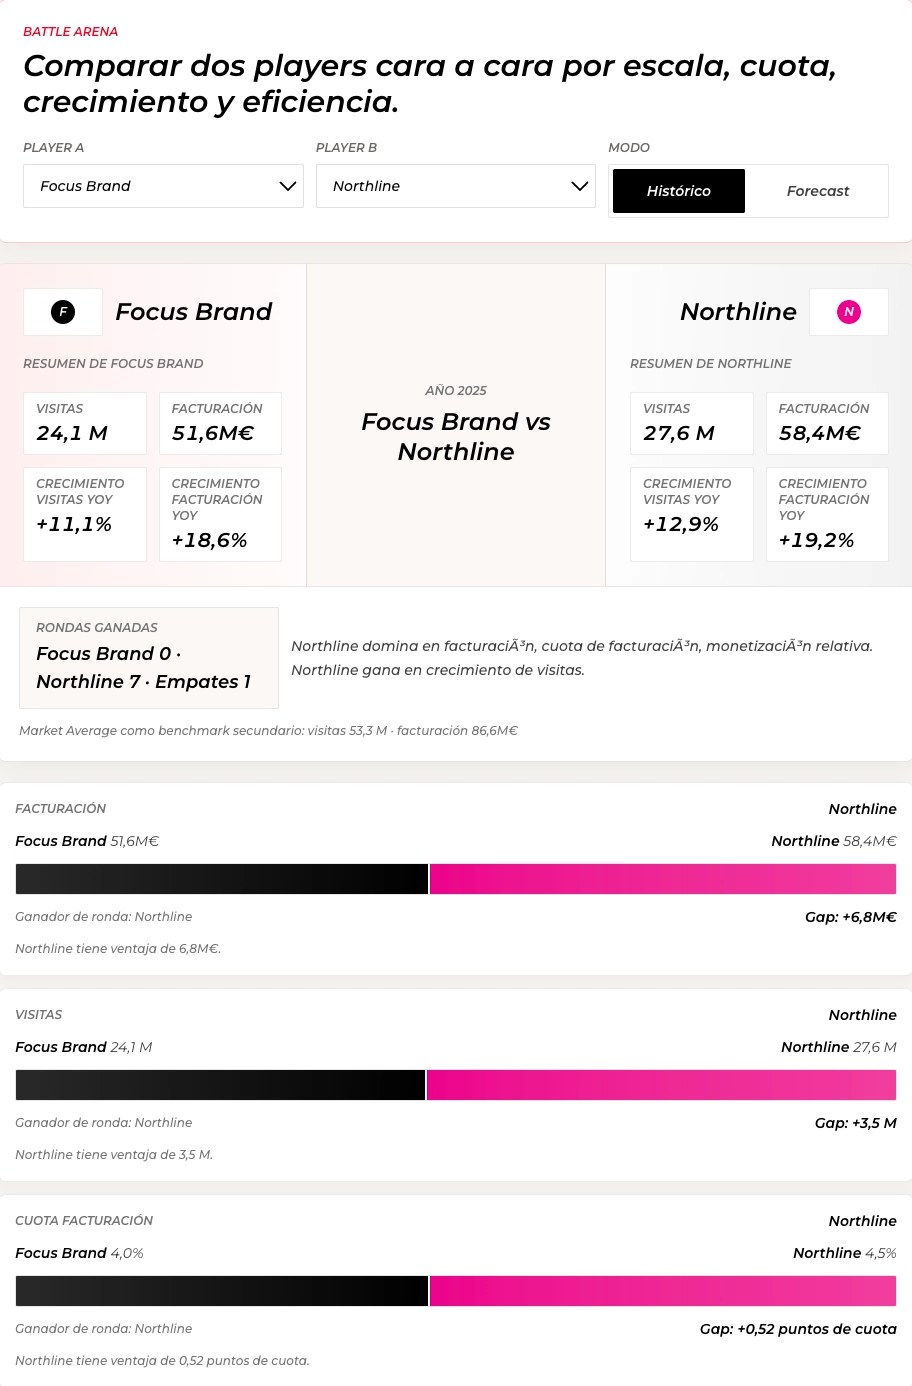
Battle Arena compares two synthetic benchmark players using generated scale, share, growth, and efficiency metrics.
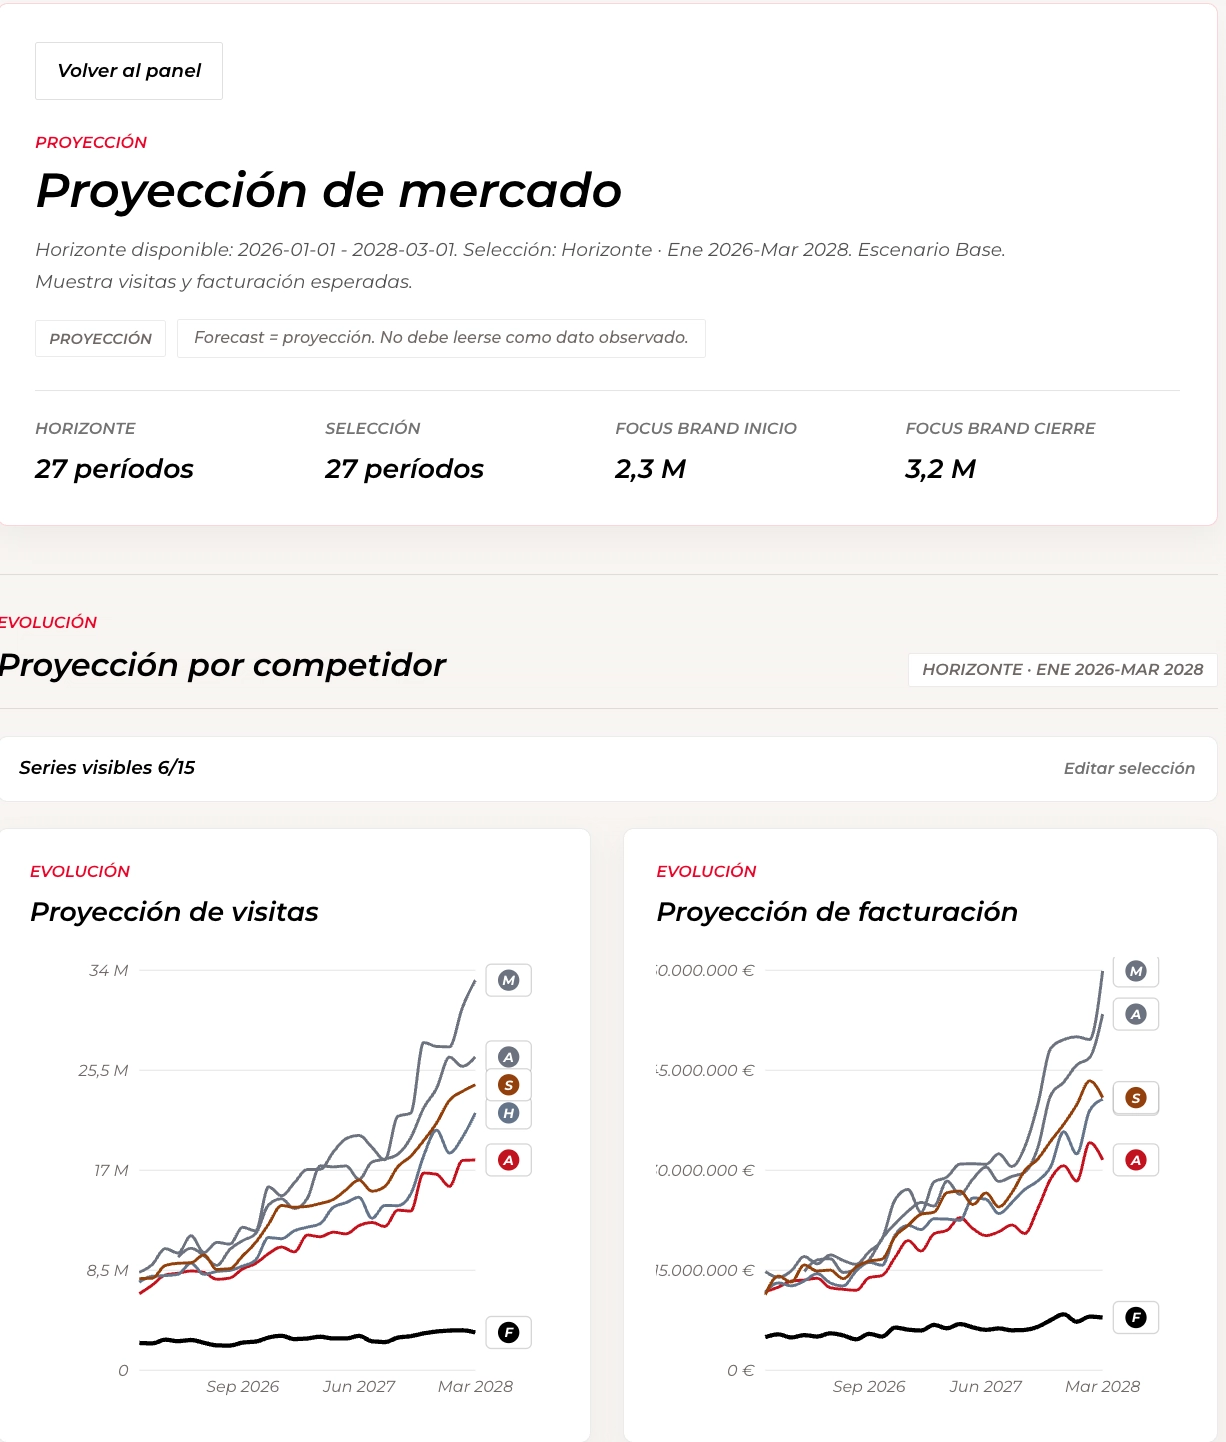
Forecast view with local scenario projections starting after 2025-12-01 and recalculated benchmark rows for each scenario.
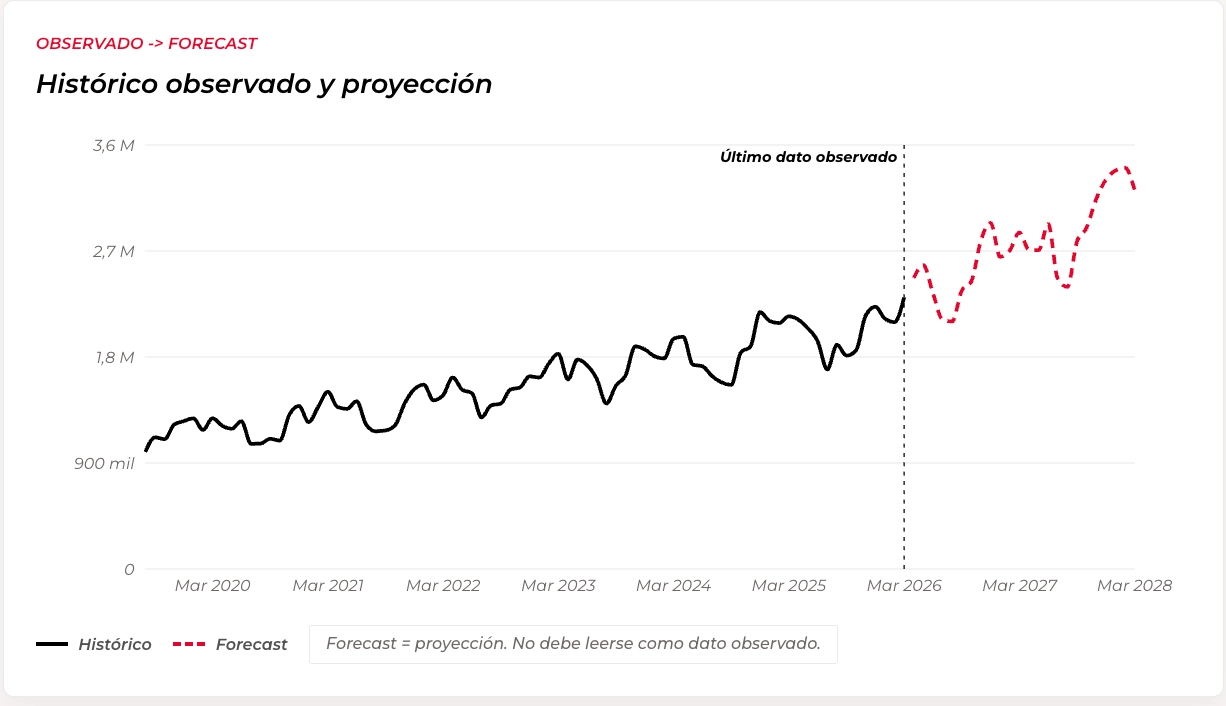
base_case, conservative, and aggressive scenarios include confidence diagnostics and stay framed as scenario projections.
Data contract
The JSON stores raw monthly observations only. The app generates interface rows internally: forecast rows, market_total and market_average rows, market share, ranks, indexed metrics, growth metrics, revenue per visit, and monetization gap are all generated in code.
{
  "ok": true,
  "meta": {
    "dataset_name": "Demo Benchmark Dataset",
    "currency": "EUR",
    "source_type": "raw_monthly_observations",
    "data_policy": "Synthetic demo data only. No real company or client data is included."
  },
  "data": {
    "source_monthly": [
      {
        "date": "2025-01-01",
        "company_id": "focus",
        "display_name": "Focus Brand",
        "market": "Demo Market",
        "type": "own",
        "revenue": 125000,
        "visits": 82000,
        "active": true
      }
    ]
  }
}source_monthlygenerated rowsgenerated metricsPublic-safe build discipline
The repo is designed to be inspected publicly. It uses synthetic company names, synthetic values, no private client data, no credentials, no required backend, no paid API dependency, validation scripts, public audit checks, security notes, deployment documentation, and a deterministic demo-data generator.
pnpm generate:datapnpm testpnpm buildpnpm validate:datapnpm audit:publicpnpm typecheckpnpm lintResult
The outcome is a repeatable benchmark intelligence engine that starts with raw synthetic observations and produces the analytical layer needed for executive market-share, ranking, monetization, aggregation, and scenario-planning views.
Why It Matters
Competitive intelligence becomes more valuable when the analysis logic is repeatable. This project turns raw monthly observations into an inspectable benchmark pipeline instead of treating the dashboard as the product.
Client Relevance
A client-facing version could help brand, ecommerce, marketing, or strategy teams compare markets, monitor positioning signals, diagnose monetization gaps, and produce clearer executive readouts without rebuilding the analysis from scratch.
Discuss a Similar AI System
If your team has a creative process, internal tool, campaign workflow, or brand system worth extending with AI, send a short brief and I'll help define the clearest system logic.