RM
Back to case studies

Machine Learning / Inventory Intelligence

DemandOS

Inventory decisions from raw commerce data.

DemandOS converts raw synthetic commerce records into forecasts, risk signals, reorder guidance, diagnostics, and monitoring surfaces. Suppliers, products, stores, orders, inventory snapshots, promotions, and purchase orders provide the source data for those outputs.

Raw synthetic recordsForecasting MLNeon + VercelNo external actions
Machine LearningForecastingOperations IntelligenceInventory RiskFastAPINext.jsscikit-learnNeon PostgresVercelSynthetic DataMonitoringScenario Planning
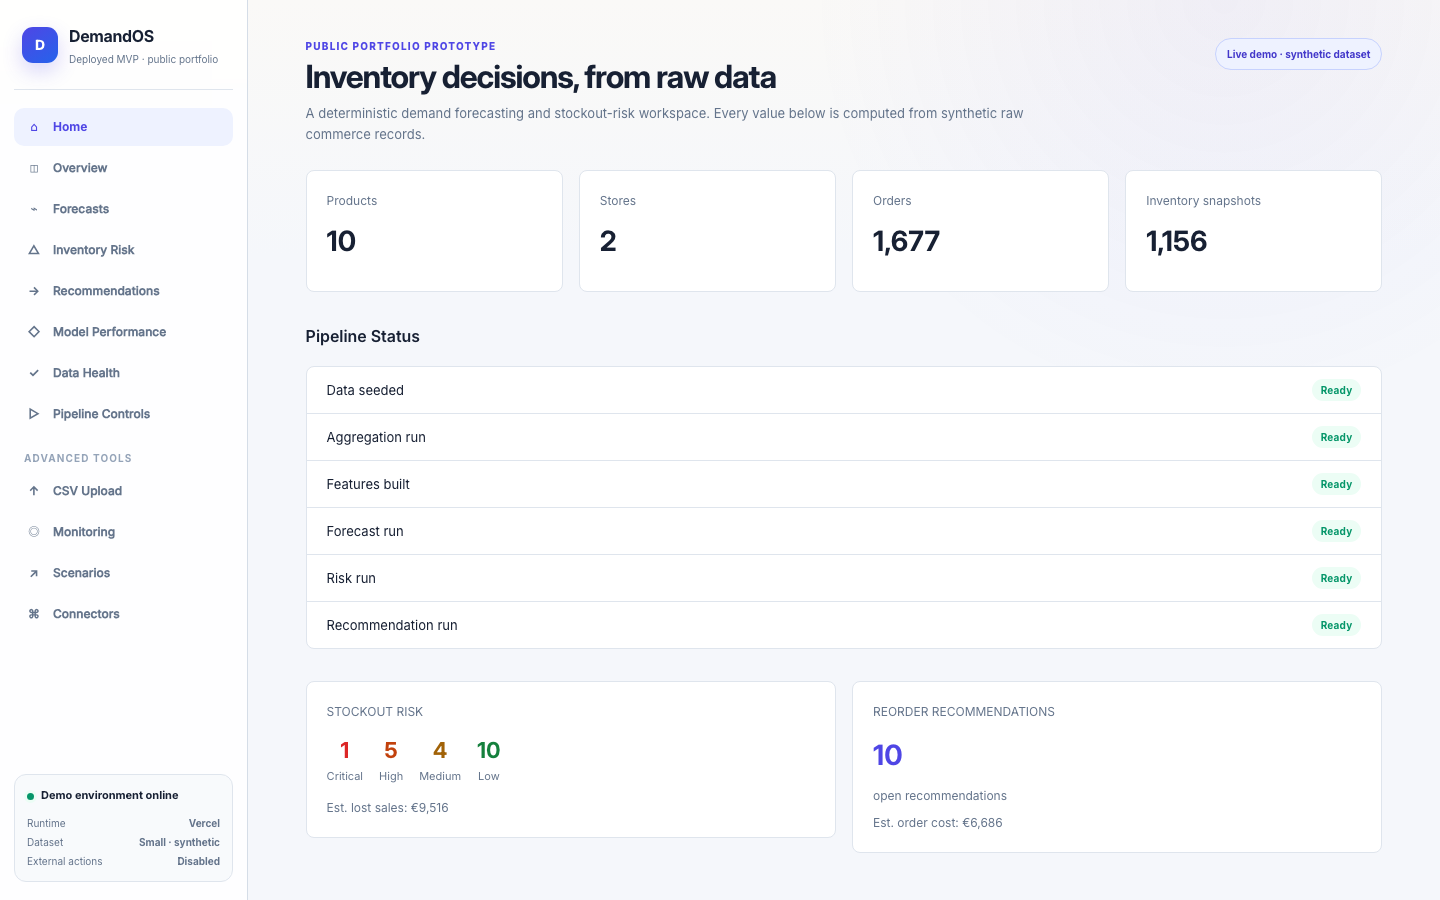
DemandOS cockpit showing pipeline readiness, inventory risk, and reorder recommendations
Public demo with synthetic operational data and external side effects disabled.

Strategic thesis

For inventory decisions, reliability beats autonomy.

ML is used for forecasting and diagnostics. Deterministic code handles ingestion, validation, schema contracts, feature engineering, routing, safety gates, and side-effect control. The system is designed to be auditable and reproducible: it does not use autonomous agents to make purchasing decisions, contact suppliers, or create purchase orders.

Case Snapshot

The strategic brief

The problem, the system response, the available proof, the strategic value, and the intentional boundary.

01Problem
Retail operators often have fragmented operational data but limited visibility into demand, stockout risk, and reorder urgency.
02System
A deterministic ML pipeline that converts raw synthetic commerce records into forecasts, stockout-risk scores, and internal reorder guidance.
03Proof
Live demo, GitHub repo, raw-data pipeline counts, model metrics, dashboard screenshots, backend tests, smoke checks, and public-readiness validation.
04Value
Helps operators prioritize what may run out, what needs replenishment attention, and where planning risk is increasing.
05Limitation
Synthetic portfolio prototype; no real customer data, no live ecommerce connectors, no autonomous purchases, no supplier communication, and no external side effects.

Project metadata

A public ML and data-product prototype

Type
Machine learning / data product prototype
Role
Product architecture, backend, frontend, ML workflow, deployment, and evaluation
Stack
Python, FastAPI, pandas, scikit-learn, SQLAlchemy, Alembic, Next.js, TypeScript, Neon Postgres, Vercel
Status
Public portfolio prototype
Data
Synthetic operational commerce data
Safety
No purchases, supplier communication, live connectors, or external side effects
Year
2026

Problem

From operational data to inventory decisions

Retail and ecommerce teams often work from fragmented records: catalogs, stores, orders, inventory snapshots, suppliers, promotions, and purchase orders. A conventional dashboard can explain what happened, but it rarely connects those records to forecasts, model quality, stockout risk, and reviewable replenishment decisions.

Can a credible ML workflow turn commerce records into inventory guidance without real customer data or seeded dashboard outputs?

Product objective

An internal ML tool for inventory guidance

The goal was to build a working loop that starts with raw operational data, evaluates models, and ends in reviewable guidance while keeping the system safe and non-autonomous.

+

What it does

  • Generates synthetic operational data.
  • Cleans, validates, and aggregates records.
  • Builds leakage-safe features.
  • Trains and evaluates forecasting models.
  • Calculates stockout risk.
  • Proposes internal reorder recommendations.
  • Supports scenario simulation.
  • Exposes monitoring and health checks.
  • Prepares disabled Shopify/WooCommerce connector stubs.

What it does not do

  • Does not use real customer data.
  • Does not create real purchase orders.
  • Does not contact suppliers.
  • Does not run live connectors.
  • Does not automate purchasing.
  • Does not claim production-calibrated accuracy.
  • Does not seed forecasts, risks, or recommendations as final KPIs.

Architecture decision

Deterministic ML workflow, not an autonomous agent

Models handle forecasting and diagnostics. Ingestion, validation, routing, schema contracts, safety gates, and side-effect control remain deterministic. The steps are known; the product decision is to make them reliable, inspectable, and repeatable.

  1. 01Raw commerce data
  2. 02Cleaning / validation
  3. 03Canonical daily tables
  4. 04Leakage-safe features
  5. 05Forecasting models
  6. 06Model metrics
  7. 07Stockout risk
  8. 08Reorder guidance
  9. 09Dashboard

Every derived layer is computed and persisted before the next stage consumes it.

Data pipeline

The demo starts with raw records, not invented metrics

DemandOS does not seed final KPIs, precomputed forecasts, risk scores, or recommendations. It starts from synthetic operational entities and calculates every downstream layer.

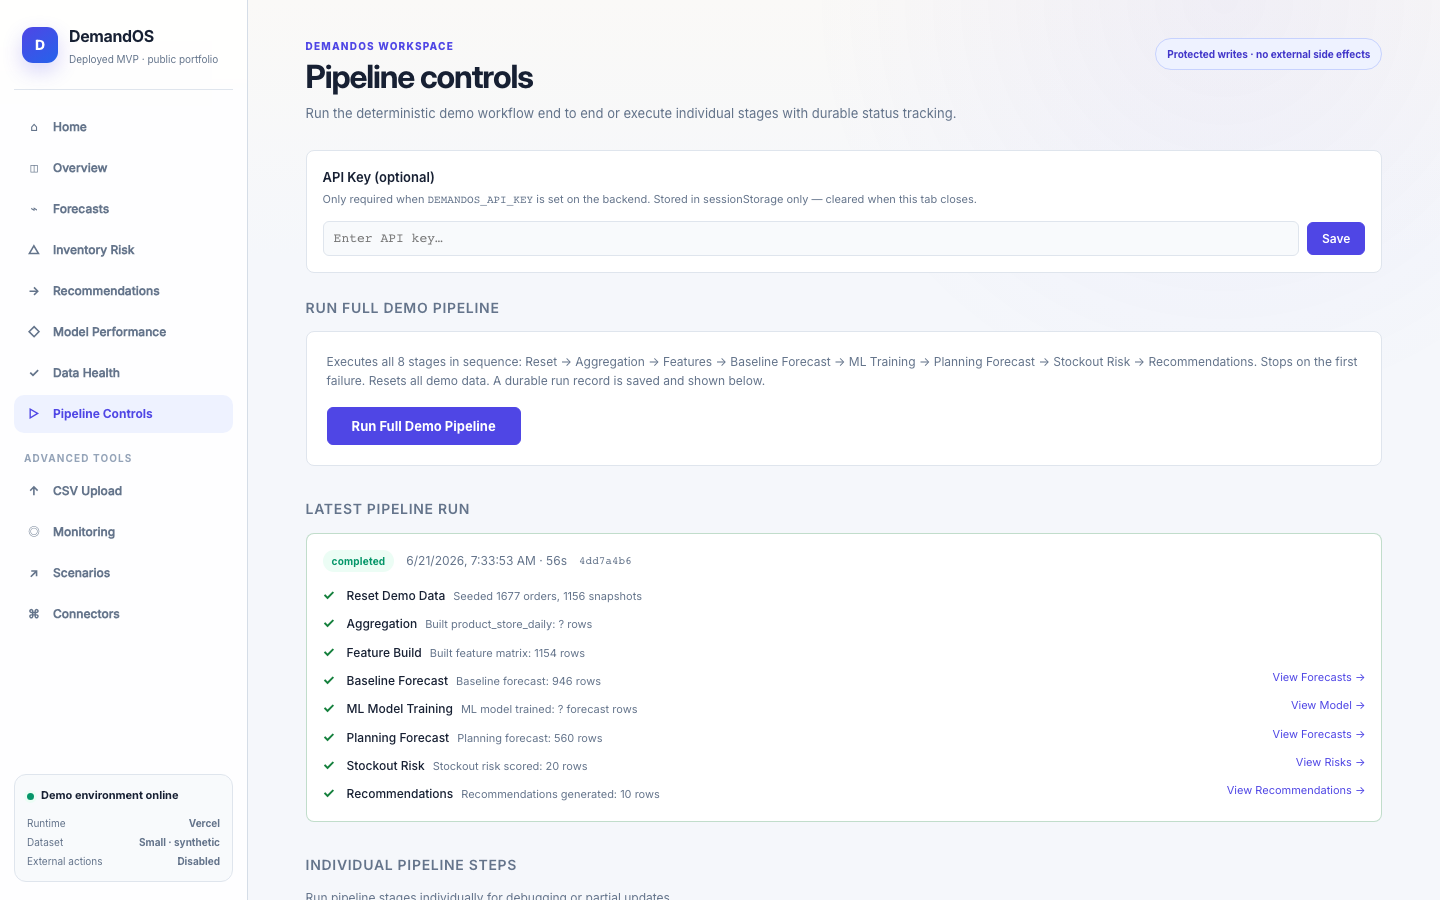
SuppliersProductsStoresOrdersInventory snapshotsPromotionsPurchase orders
10products
2stores
1,677orders
1,156inventory snapshots
1,154feature rows
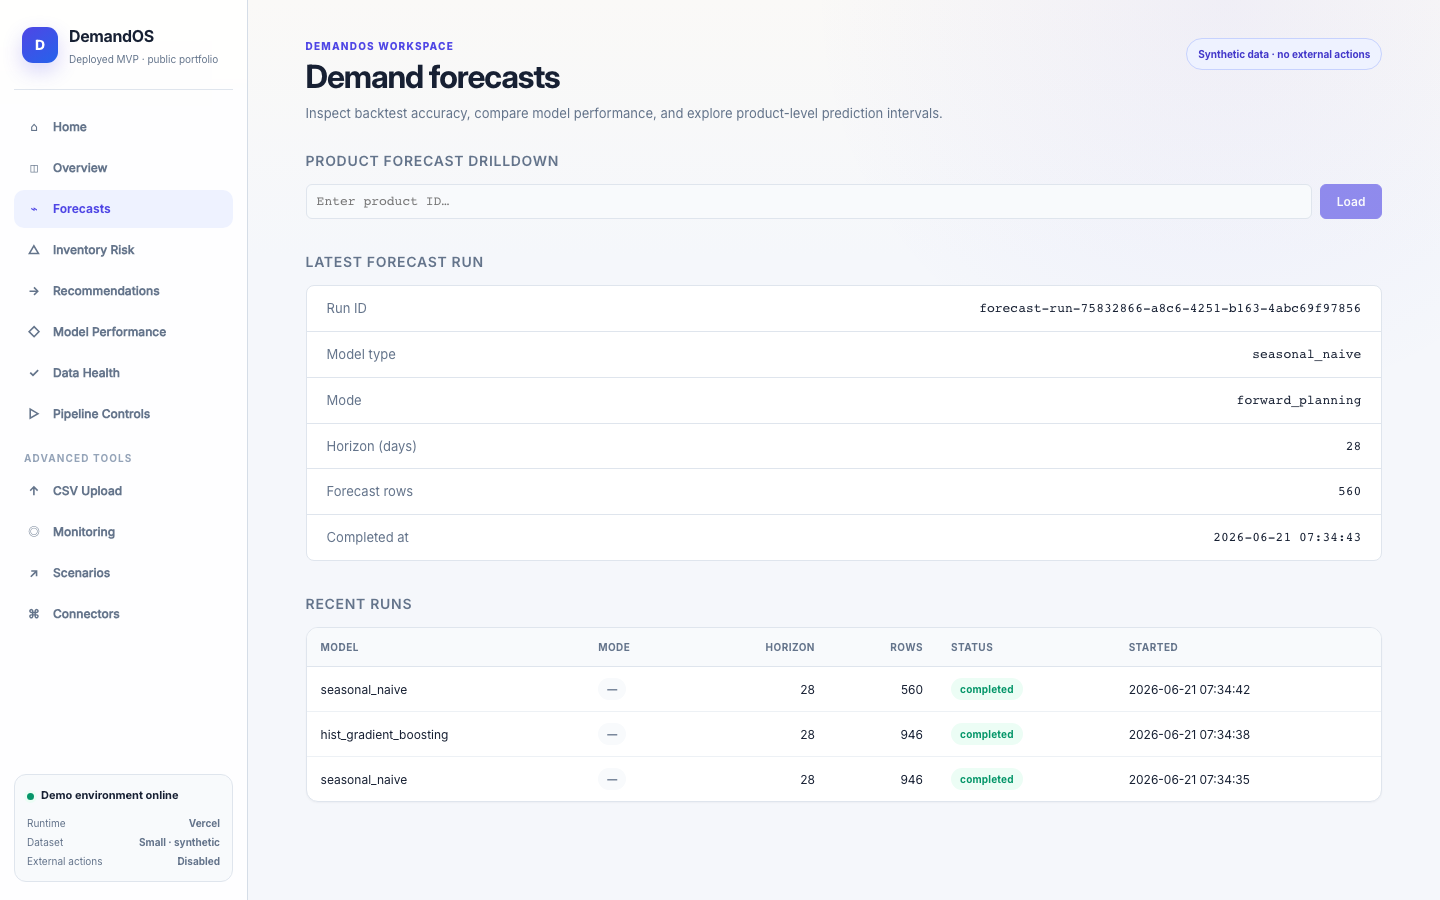
946baseline forecasts
560planning forecasts
20risk rows
10recommendations

Counts validated in a small-mode demo run; they may change after reseeding.

Raw vs derived

The dashboard is computed, not pre-filled

DemandOS starts from operational entities and computes planning surfaces internally. This is the proof boundary between raw demo data and product outputs.

Raw inputComputed by DemandOS
OrdersDemand forecast
Inventory snapshotsDays until stockout
Purchase ordersInbound coverage
Supplier lead timesReorder timing
Products and storesProduct/store risk ranking
PromotionsDemand feature context
Sales historyForecast baseline comparison

Forecasting and ML layer

Forecasting as a core product layer

Baselines provide a transparent comparison point. The global model uses scikit-learn and demand, inventory, calendar, promotion, price, and lifecycle features. Its outputs feed stockout risk and reorder guidance.

Baseline

Comparison before complexity

Seasonal naive and moving averages establish readable references. The ML model is not forced to win.

ML

HistGradientBoostingRegressor

Global model over product/store series, trained on a feature matrix that excludes future information.

Evaluation

Honest backtesting

Temporal split, non-negative predictions, persisted metrics, and p10/p90 bands documented as heuristics.

WAPE

Weighted total error as a percentage of aggregated actual demand.

MAE

Mean absolute error between observed demand and forecast.

RMSE

Metric that penalizes large misses more strongly.

Bias

Shows whether the model tends to over- or under-forecast demand.

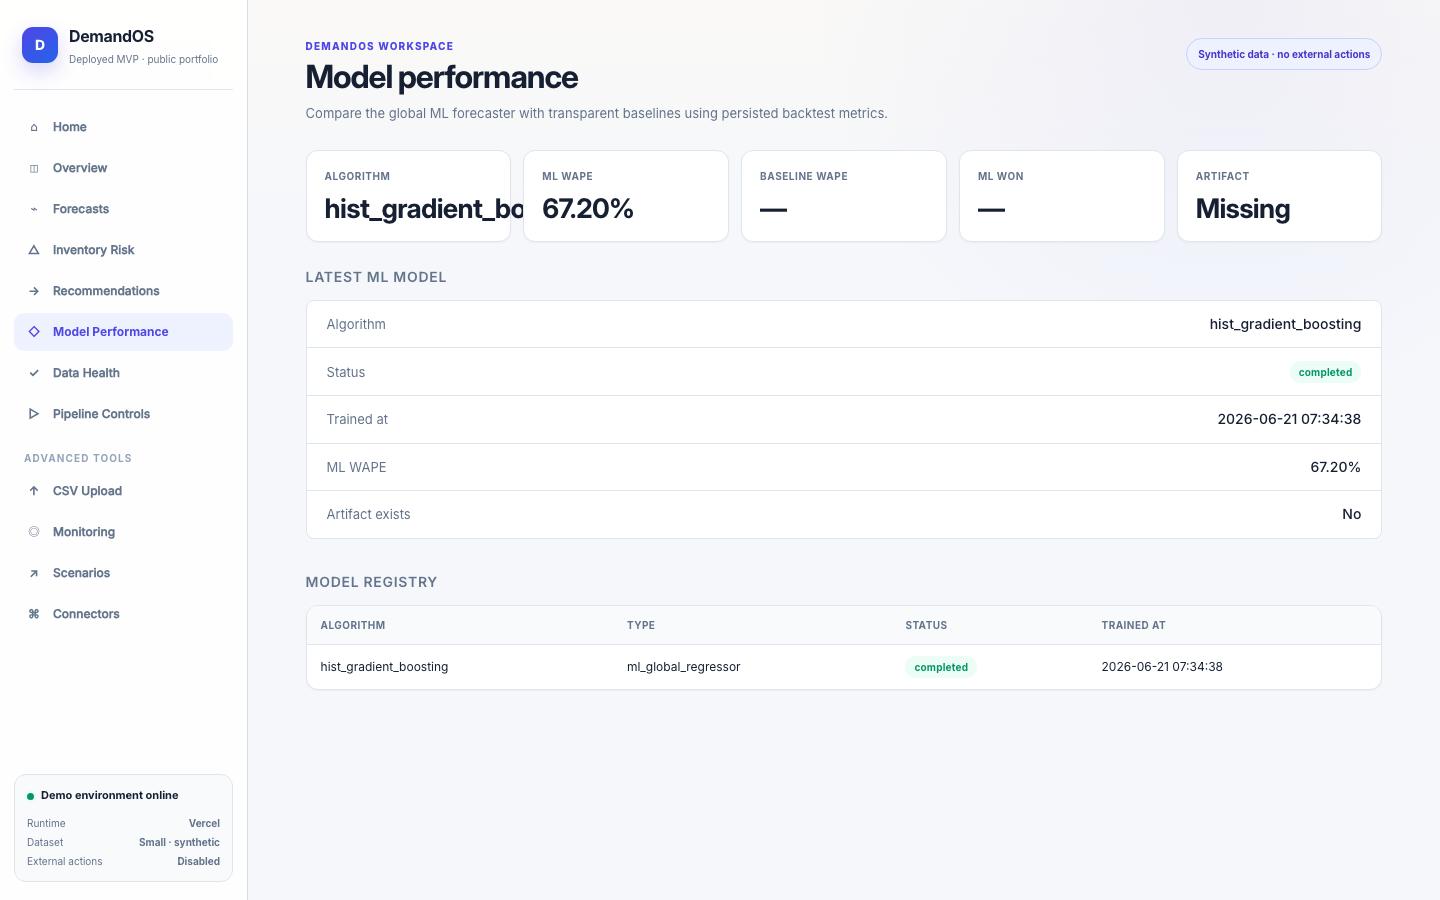
In this prototype, WAPE is a directional quality signal. A high WAPE is not hidden: the interface explains that the forecast is useful as a demo planning signal, not as a production-calibrated model.

ML Insights

An interpretation layer for understanding the model

The data-science surface organizes summary diagnostics, model comparison, signal groups, and business-impact interpretation without mutating the database.

/api/data-science/summary/api/data-science/forecast-diagnostics/api/data-science/model-comparison/api/data-science/feature-signals/api/data-science/business-impact

The five endpoints are read-only: they explain the system and its outputs, but do not run training, pipelines, or state changes.

Feature engineering

From features to interpretable signals

Signals describe information used by the model or associated with demand patterns. They are not presented as causal relationships.

Recent demand

Lags and rolling windows before the target day.

Seasonality

Calendar, weekday, and temporal patterns.

Price and margin

Price, cost, margin, and recent changes.

Promotions

Promotional exposure and observed lift in the data.

Coverage

Available inventory, stockout flag, and days of supply.

Lifecycle

Product age and maturity stage.

Channel

Store, category, and sales-channel signals.

Risk and recommendations

From forecast to operational risk

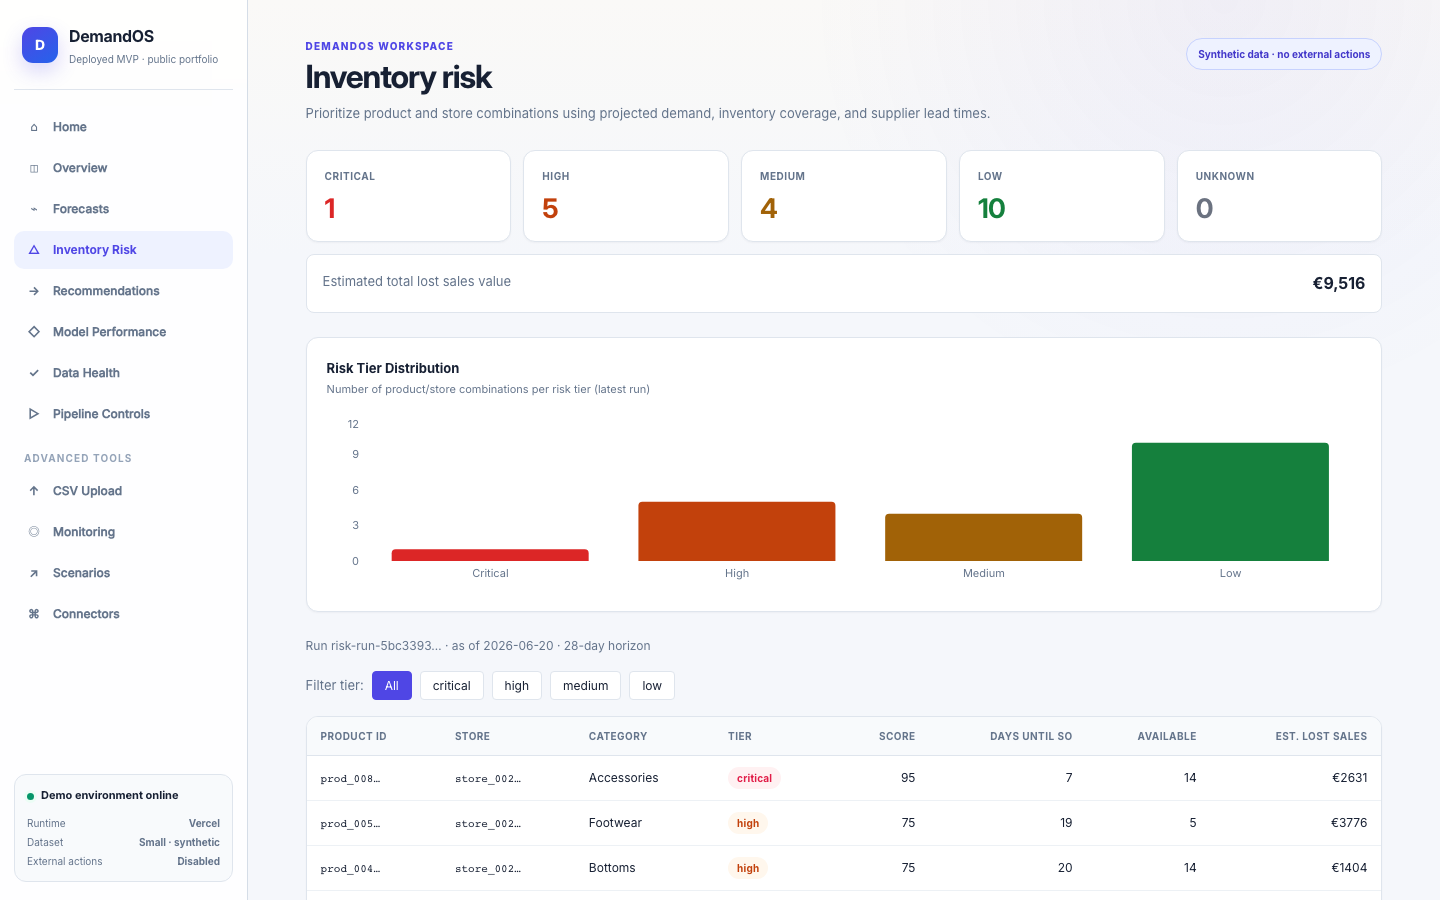
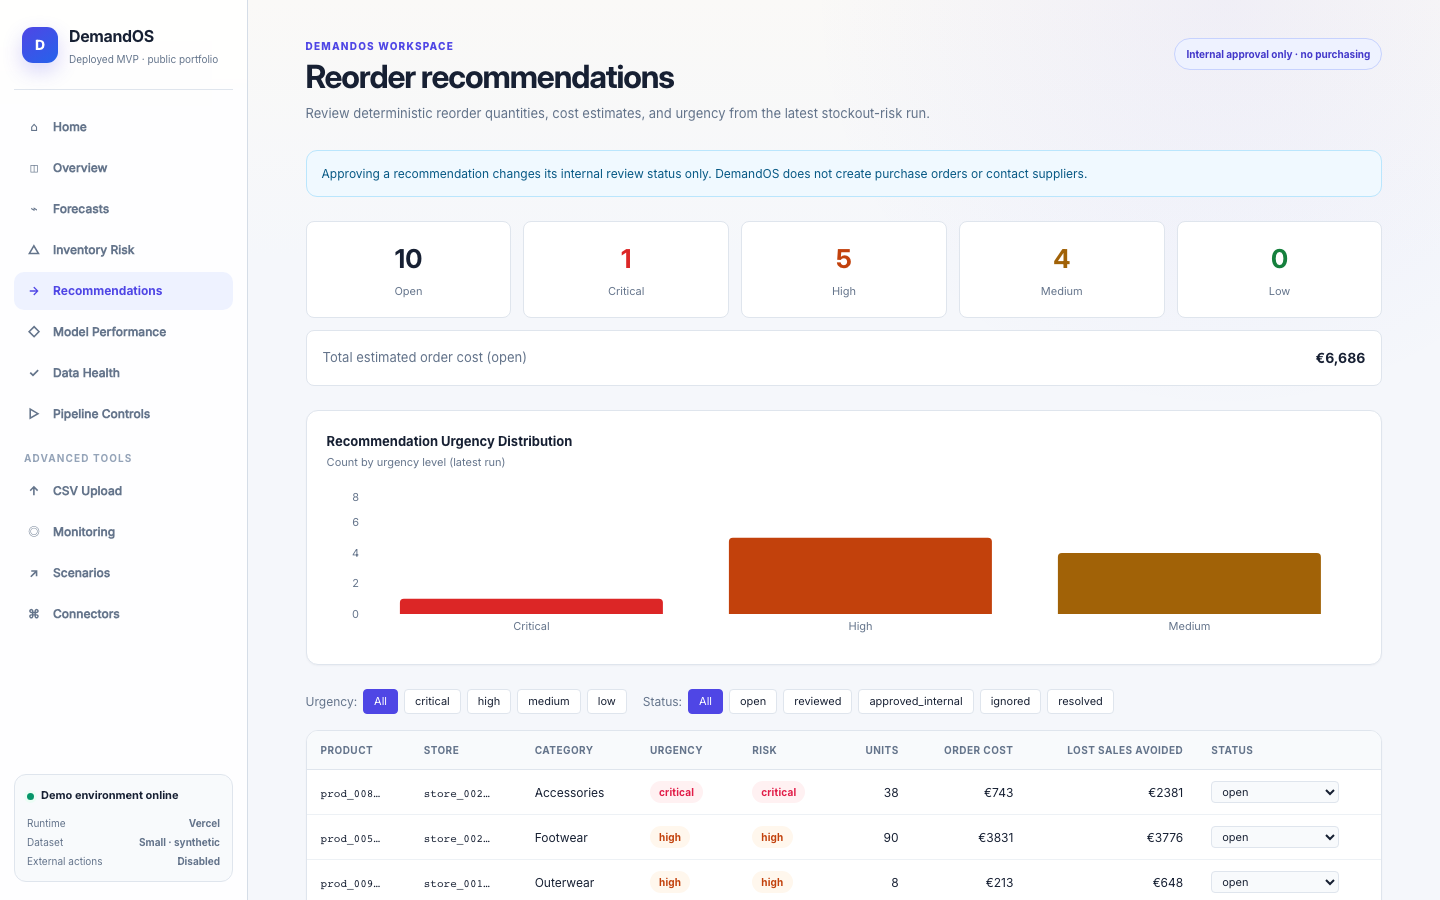
Risk combines predicted demand, current inventory, inbound supply, lead time, supplier reliability, safety stock, and estimated lost sales. Recommendations are internal review guidance: never real purchase orders.

1critical risk
5high risks
4medium risks
10low risks
10open recommendations
~ EUR 9,516lost-sales exposure
~ EUR 6,686estimated order cost

Visible output from a validated demo run; values can change after rebuilding the dataset.

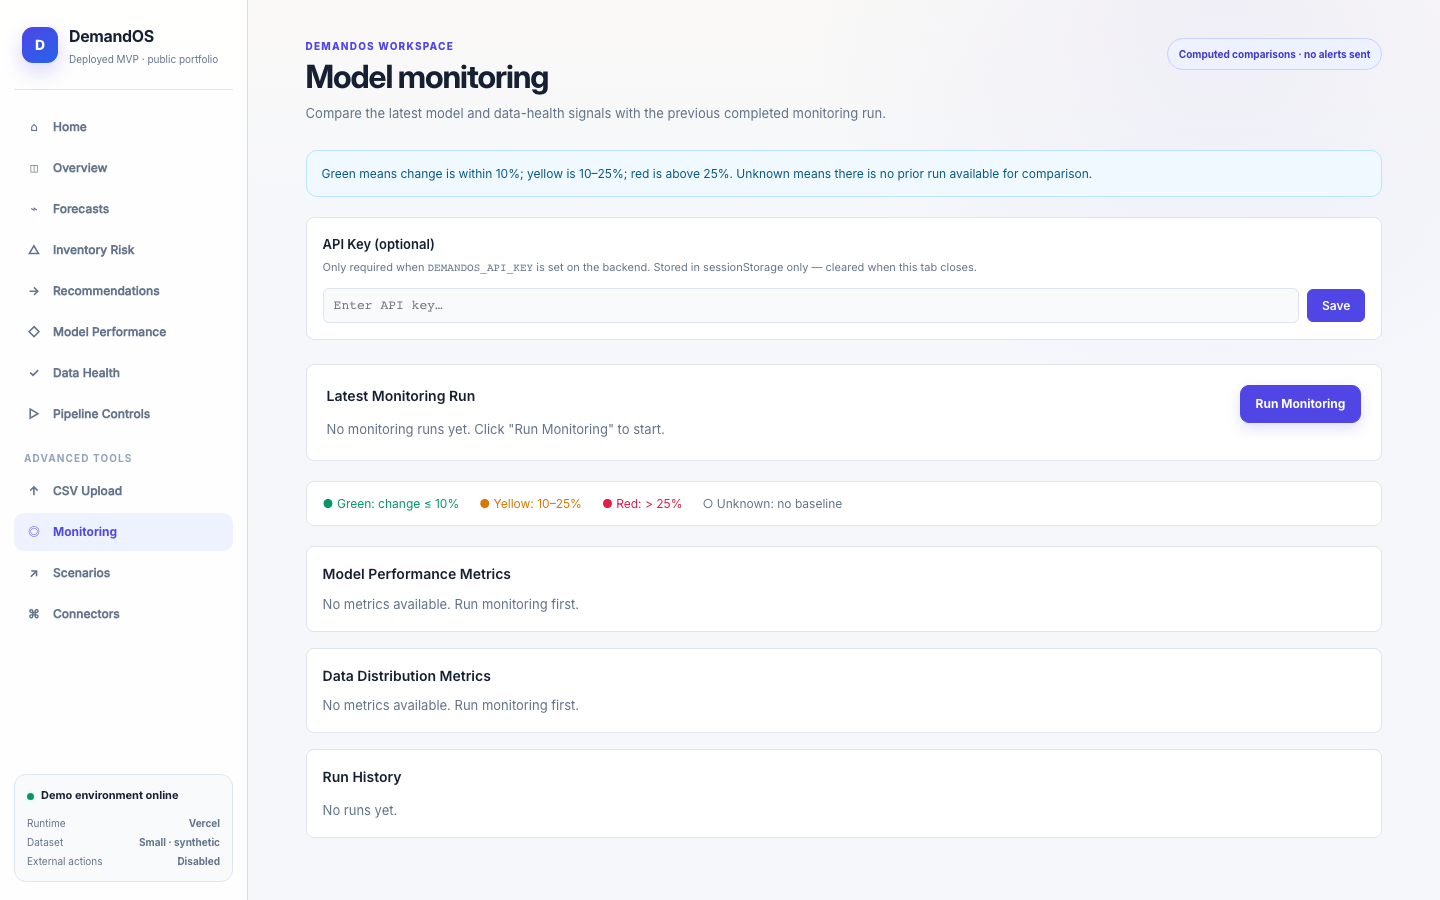
Monitoring

Simple, readable comparisons

Compares recent model metrics and data health against prior runs with documented states and thresholds, without turning a demo into an overclaim.

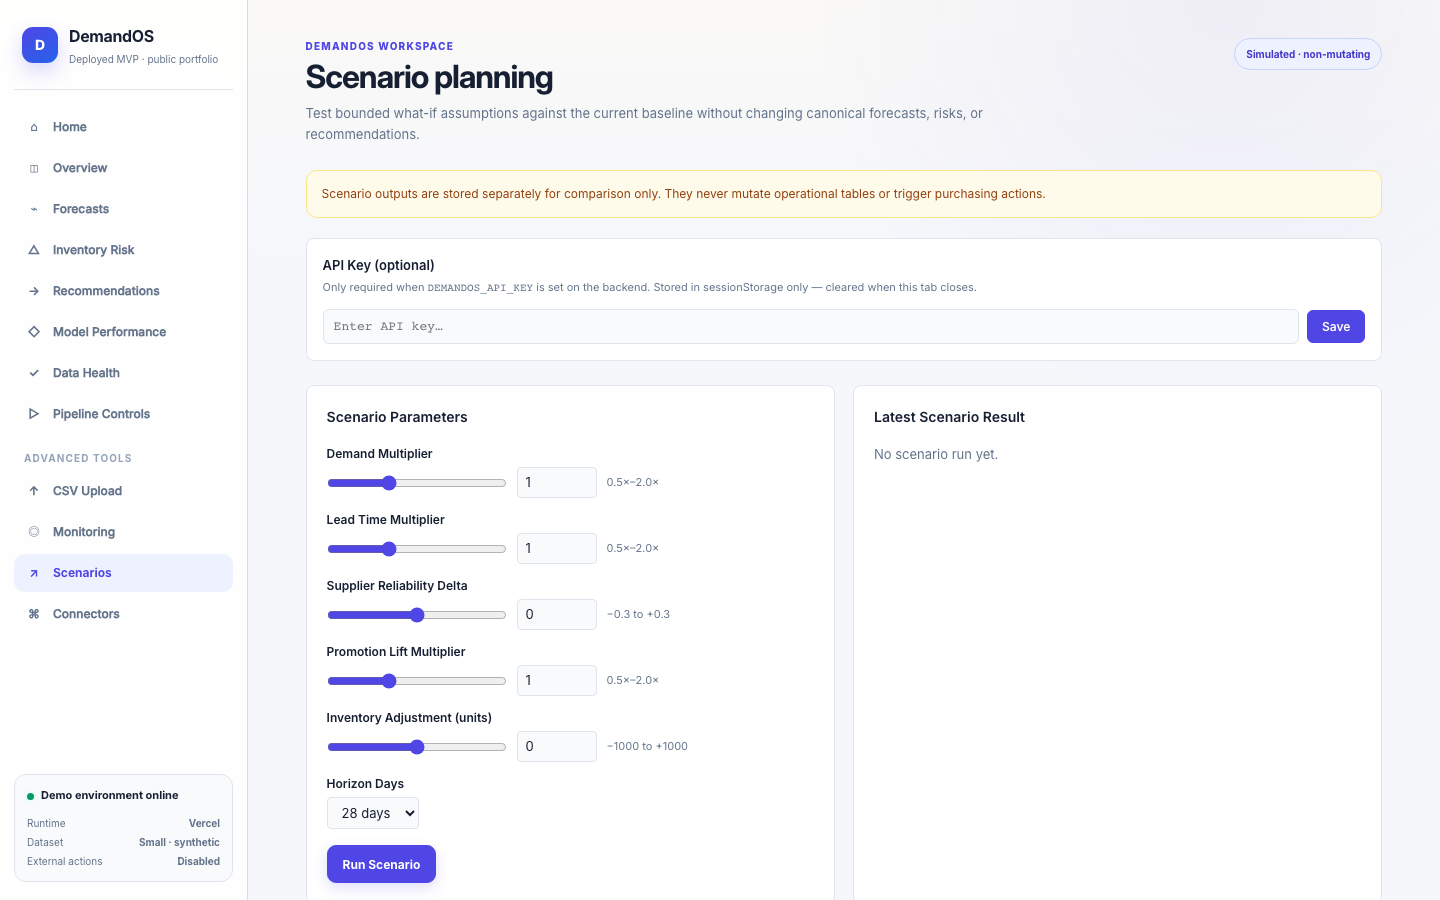
Scenario planning

Simulate without mutating the source of truth

Scenarios are stored separately, labeled as simulated, and never alter canonical risk or recommendation tables.

Demand multiplierLead-time multiplierSupplier reliabilityPromotion liftInventory adjustmentsPlanning horizon

Extensions

Prepared, but safe by default

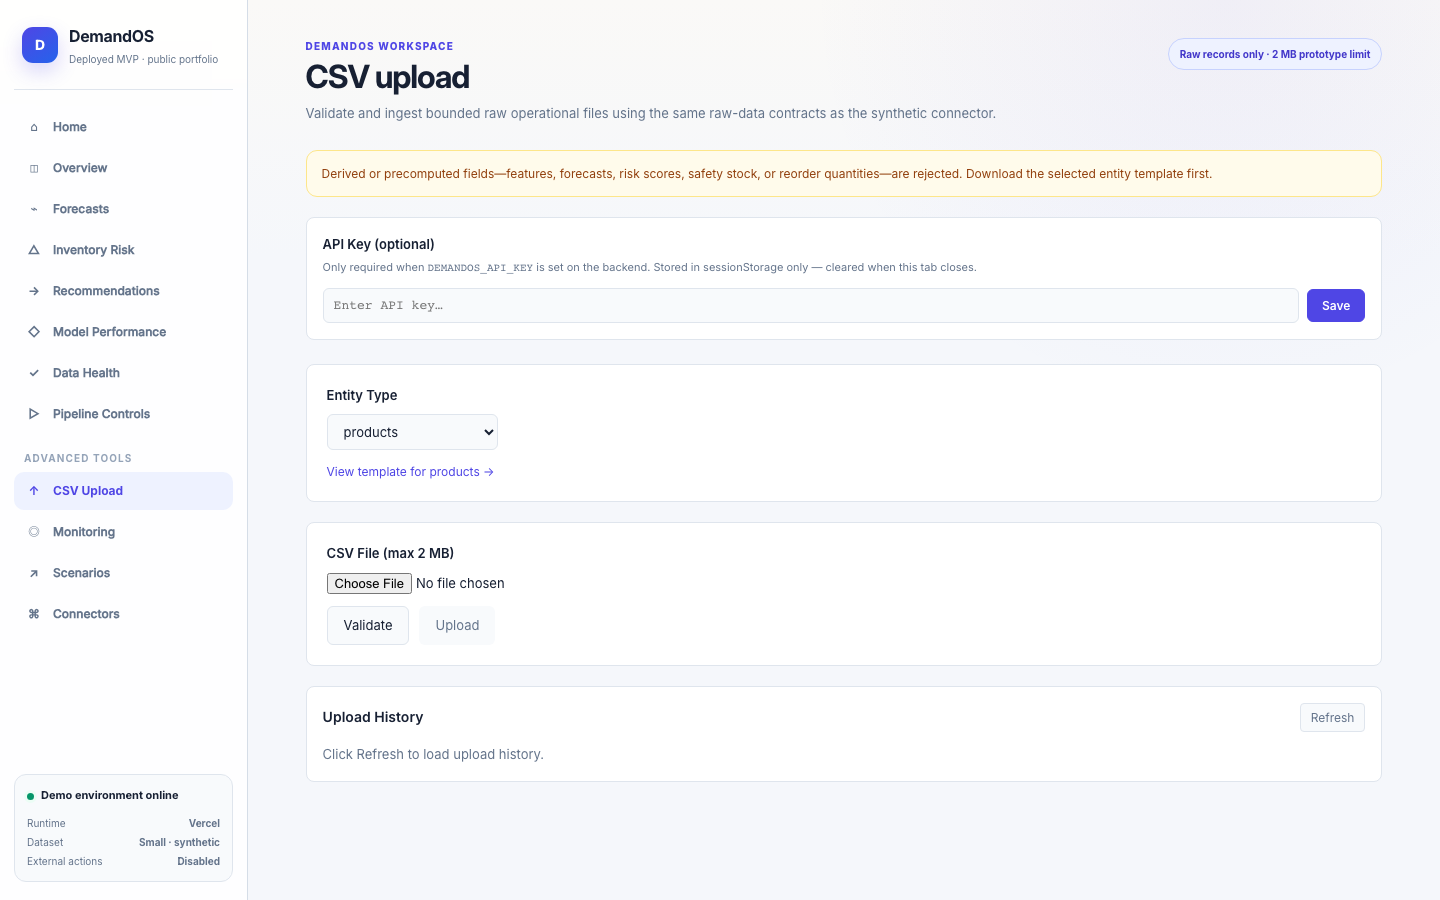
CSV Upload

Only raw operational records

Validates raw entities, rejects derived lags, forecasts, scores, and recommendations, limits files to 2 MB, and writes audit records.

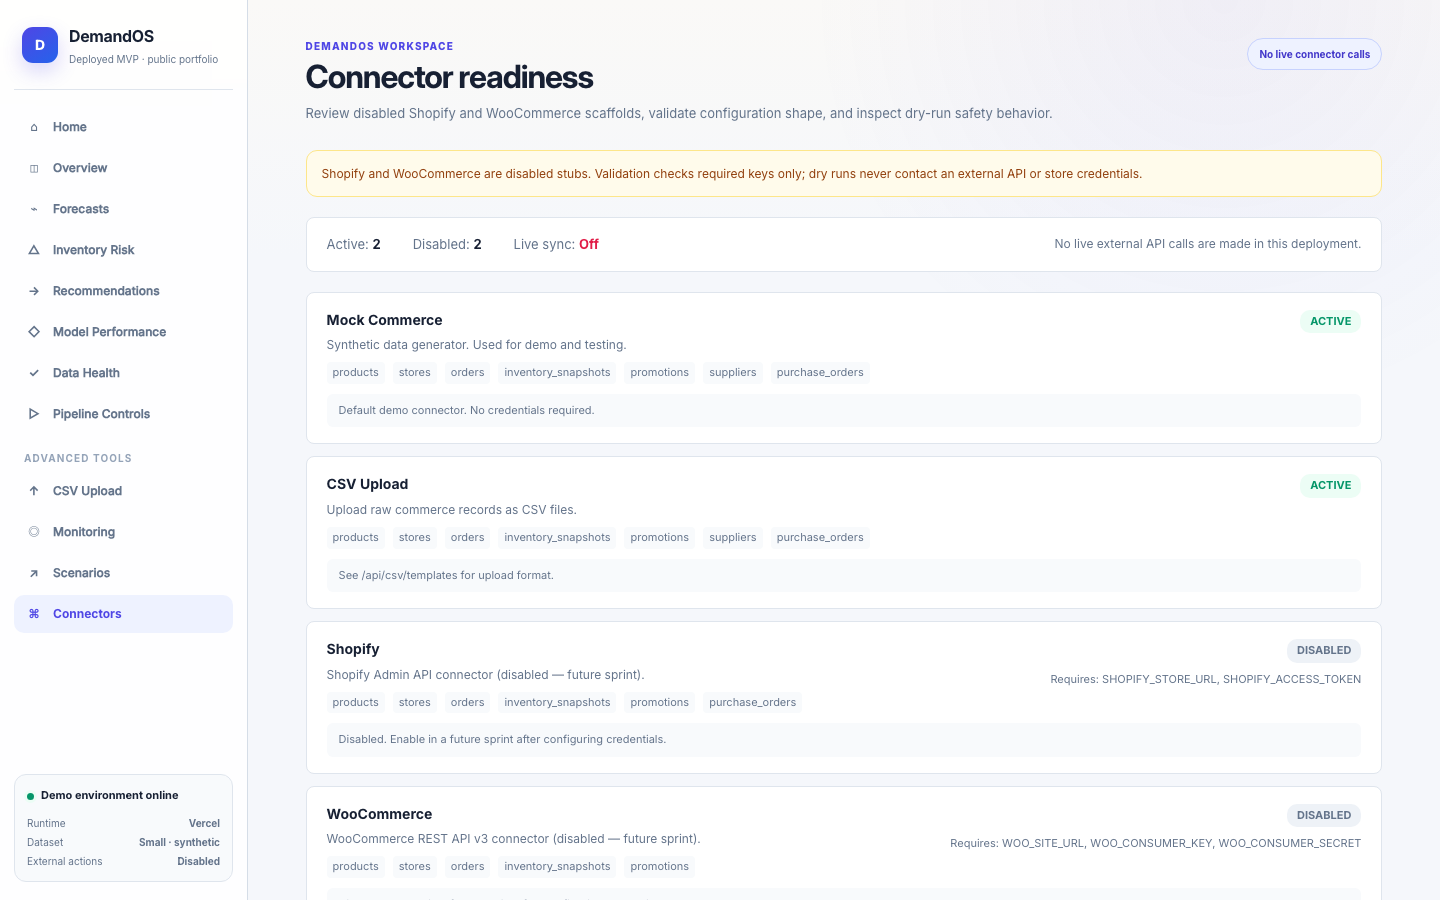
Connector Prep

Shopify and WooCommerce disabled

Stubs only validate configuration shape. Dry runs do not call APIs, store credentials, or perform live synchronization.

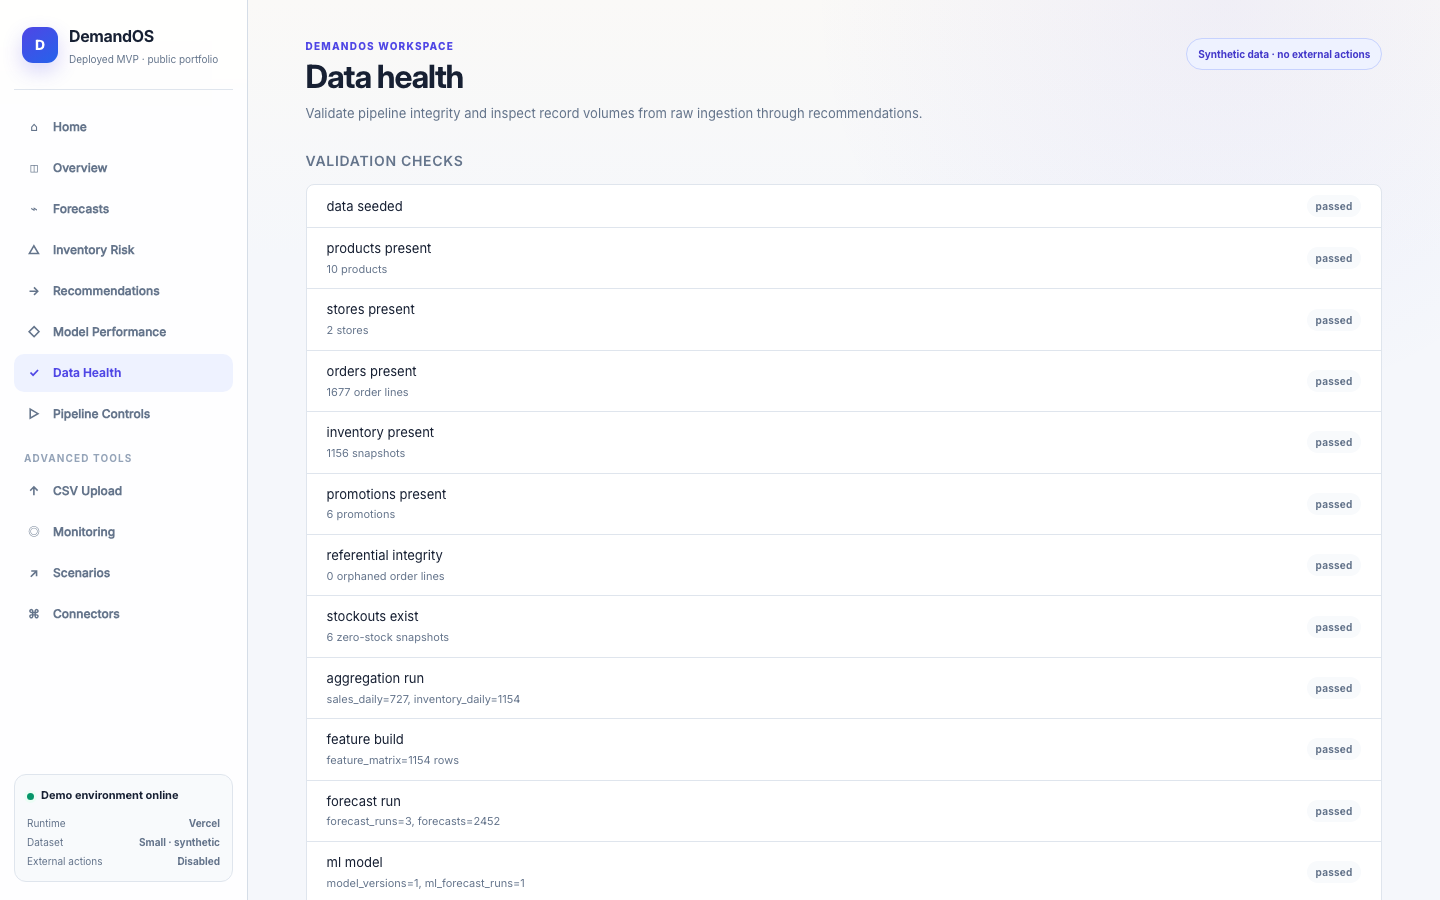
Dashboard walkthrough

From pipeline to decision surfaces

Screenshots come from the public demo and show calculated synthetic data across the product surface.

Deployment architecture

A bounded free deployment for a portfolio prototype

A Vercel project serves Next.js and a Python FastAPI function under /api/*. Neon Postgres keeps state, and browser calls are same-origin.

Browser

Next.js interface and same-origin calls

Vercel

Frontend + FastAPI function in serverless mode

Neon Postgres

Persistence for data, runs, and outputs

Small mode

Synthetic scale compatible with demo limits

A larger system would move backend, workers, and model artifacts to dedicated infrastructure. The prototype assumes serverless limits, ephemeral artifacts, and free-tier constraints.

Reliability and validation

Tests, smoke checks, and explicit limits

Credibility does not depend on one screenshot. It depends on data contracts, tests, safety checks, and validation against the public deployment.

451unique backend tests passing
Passingfrontend typecheck + build
201checks in scripts/verify.sh
Passingpublic-readiness scan
29 / 29production smoke checks
0secrets or external effects detected

An earlier backend count was higher because it included untracked duplicate copies. The public case uses the clean count of unique tests.

Safety boundary

Allowed vs blocked

Read-only public endpoints are available. Write and control actions are API-key protected, and the prototype does not cross into external actions.

AllowedBlocked
Internal reorder recommendationsReal purchase orders
Synthetic CSV uploadsReal customer production data
Scenario simulationSupplier emails
Connector dry runsLive Shopify/WooCommerce calls
Forecast and risk diagnosticsAutonomous purchasing
Public portfolio demoExternal side effects

Result

A complete ML workflow

DemandOS demonstrates an end-to-end workflow: raw ingestion, validation, feature engineering, forecasting, model diagnostics, risk and recommendations, monitoring, scenarios, deployment, and publication discipline.

Portfolio ML work is stronger when the model lives inside a reliable workflow for ingestion, validation, features, evaluation, explainability, safety, and deployment.

Limits

What the prototype does not prove

  • It only uses synthetic data.
  • It is not trained on real customer data.
  • It is not a production replenishment system.
  • There is no live ecommerce integration.
  • It does not perform autonomous purchases.
  • It does not include a background scheduler.
  • The Vercel serverless runtime limits scale and duration.
  • Neon is used within prototype/free-tier limits.
  • Forecast quality is calibrated for demo use, not production.

What I learned

The model is only part of the product

The project combined model training with the environment needed to review its outputs: data contracts, validation, leakage-safe features, interpretable metrics, observability, safety boundaries, and an interface that helps decide what to review first.